
Client: Pharmaceuticals (Global Manufacturing Company)
Dataset Source: Gottlieb-Cruickshank distributor — Poland sales (January 2018)
Source https://www.kaggle.com/datasets/akanksha995579/pharma-data-analysis/data
Prepared by: DataScientist.ca
1. Executive Summary
This case study documents an end-to-end solution for analysing distributor-supplied retail-level pharmaceutical sales data for Poland (January 2018). The client asked for interactive reporting to support three personas: Executive Committee, Sales Managers / Reps, and Head of Sales. The deliverable is a Power BI solution featuring an Executive Summary, Distributor & Customer Analysis, and Sales Team Performance pages built on a star-schema data model. Key outcomes include identification of top product classes, highest-performing products, top customer cities, and drillable views by channel/sub-channel and sales teams.
Top business questions answered – What are overall sales and units by month/year, city, channel and sub‑channel? – Which product classes and products drive the most revenue? – Who are the top managers, reps and sales teams by sales and volume? – What customer cities should be prioritized for field coverage or promotional activity?
2. Data Description (Provided)
The CSV (pharma-data.csv) contains the following columns: Distributor, Customer Name, City, Country, Latitude, Longitude, Channel, Sub-channel, Product Name, Product Class, Quantity, Price, Sales, Month, Year, Name of Sales Rep, Manager, Sales Team.
All records are for Gottlieb-Cruickshank (distributor) and Poland (country) for January 2018.
3. Proposed Solution & Architecture
Please see dashboard for complete information general information is provided below
Deliverables – Power BI Desktop file (.pbix) with three report pages (Executive Summary, Distributor & Customer Analysis, Sales Team Performance). – Star-schema data model (FactSales + dimension tables: DimProduct, DimCustomer, DimLocation, DimTime, DimSalesTeam, DimDistributor).
Architecture 1. Ingest CSV into Power Query. 2. Light transformation & data-quality checks. 3. Build dimensions and fact table in Power Query / Power BI data model. 4. Create DAX measures and visuals; publish to Power BI Service.
4. Data Cleaning & Transformation
Result: Clean single fact table that was denormalized into a star schema.
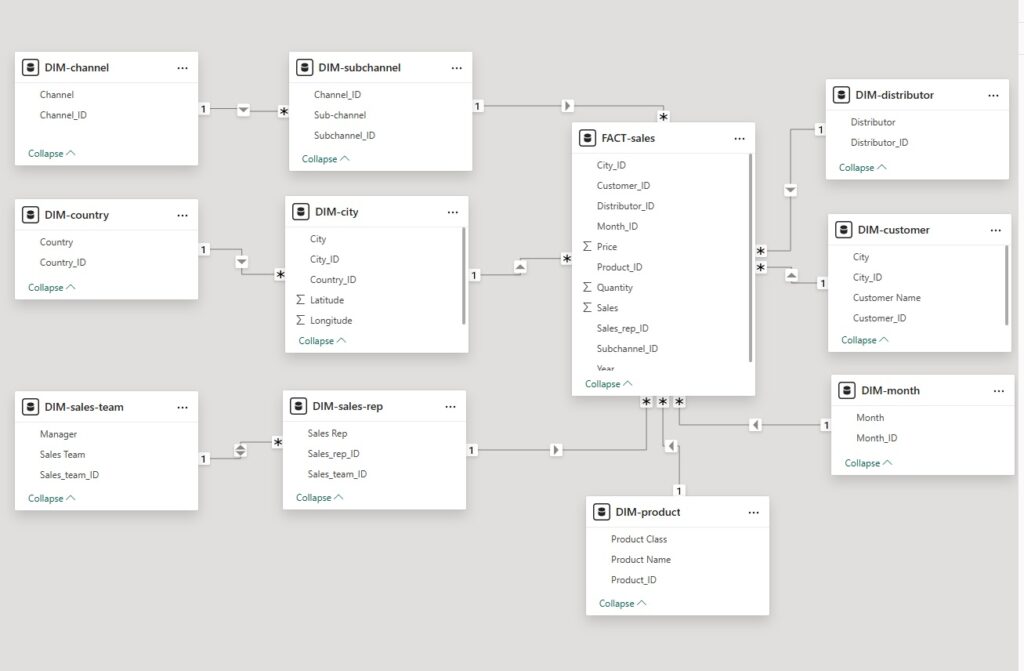
5. Data Model (Star Schema)
7. Report Pages & Visualizations
Executive Summary (for Executive Committee)
Please see dashboard for actual information, general information is provided below;
- KPI cards: Total Sales, Total Quantity, Avg Price, # of Unique Customers (January 2018)
- Line/area chart: Sales trend by day (or month when multi-month data present)
- Map: Sales by customer city (bubble map using Latitude/Longitude)
- Bar chart (horizontal) Top Product Classes by Sales
- Bar chart: Top Products by Sales (top 10)
- Stacked bar: Sales by Channel and Sub-channel
- Slicers: Year, Month, Channel
Purpose: Quick identification of top drug classes, top drugs, top cities and channel splits. Executives can filter by year/month.
Distributor & Customer Analysis (for Sales Manager / Rep)
Please see dashboard for actual information, general information is provided below
- Table + matrix: Sales by Distributor → Product (drillable)
- Top 5 products, customers and cities visuals with small multiples
- Channel/Sub-channel split with percentage contribution
- Detailed transaction grid with export capability (Customer, City, Product, Qty, Price, Sales)
Purpose: Enable manager to see product-level performance and key accounts.
Sales Team Performance (for Head of Sales)
Please see dashboard for actual information, general information is provided below
- Bar chart: Sales by Sales Team
- Matrix: Sales Team × Product Class (showing contribution and percent of team sales)
- Leaderboard: Top Managers and Top Reps (sortable by sales/quantity)
- Slicer: Sales Team, Manager, Date range
Purpose: Identify top-performing teams and reps, product mix per team, and where coaching or reallocation is required.
11. Deliverables
- Power BI Desktop file (.pbix)
- Data model documentation (ER diagram and field mapping)
- User guide (how to use slicers, export data, and refresh dataset)
- DAX measure reference sheet
- Recommendations and roadmap for production deployment
Prepared as a reusable template — replace example findings with numbers from the actual pharma-data.csv when loaded into Power BI.